There are plenty of online resources on the pit market experiment (see e.g. here and here). I used several of these to build my own, and the purpose of this post is to describe the experiment, give access to the spreadsheets I used and discuss some of the results that came out of it.
Below is the few slides I used to introduce the experiment, including the instructions that remained on the board during the trading. I start by asking who is from Chicago, a city which has a long history of pit trading. Even though several students were from Chicago, they did not seem to be aware of this history (to be fair, the practice is disappearing). The slides are available here.
I separated the class in two groups and gave each student either a sheet to record their “earnings” as buyers (their surplus), or their earnings as sellers (earnings sheet here). Each round, producers have one (virtual) unit of soybean that they are trying to sell, and buyers want to buy one unit.
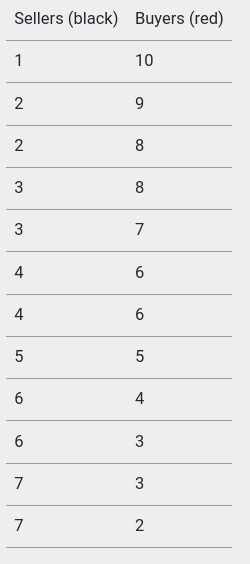 I distribute playing cards face down, the number is either the willingness to pay for a buyer or the production cost for a seller (the table on the left shows the distribution of willingness to pay and production costs). As they start to understand how their card affect their ability to trade, expect revolts to brew when students get unlucky several turns in a row.
I ask students to start trading with each other after going over the instructions. They have to come to the front desk when they make a trade, so that I can verify that their transaction is legal (they sell above their production cost or buy below their willingness to pay). I also record the transactions in a spreadsheet to have the results immediately available at the end of the experiment (spreadsheet available here). After each round of trade, I tell them how efficient they were (what percentage of surplus they realized).
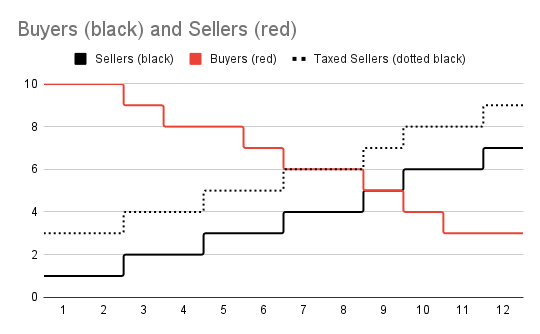
I ran three rounds with a free market, before imposing a $2 tax; I put the tax on sellers first, which of course led to protestation from them and cheers from the buyers; after three rounds, I showed some benevolence toward suppliers and shifted the tax to buyers. The graph to the right shows the supply and demand curve after a tax was imposed on sellers (the step function takes a little bit of explaining).
Results
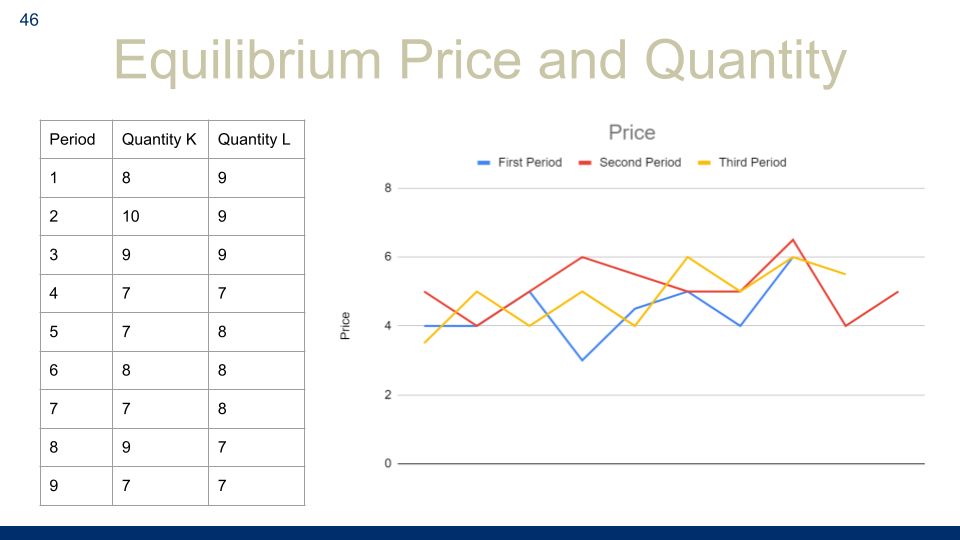
I ran the experiment after talking about the supply and demand model and equilibrium. At the end of the experiment, I showed students the price for the first three periods, but when I asked why they were all close to five, they answered someting based on average of costs and willingness to pay. I showed them how to build the supply and demand curve from the distribution of playing cards, and they can then see that five is the equilibrium price, and that the quantity they traded corresponds to the equilibrium quantity.
The attraction of the experiment is that it illustrate many concepts: beyond supply, demand and equilibrium, imposing a tax makes the deadweight loss perceptible as it becomes harder to trade. I use the results to introduce them to the equivalence between taxing producers or consumers, and to demonstrate that what matters for the distribution of the tax is the relative elasticity. Students quickly try to collude but this does not stick on the competitive pit; distribution issues arise as many complain and ask for better cards, to which I can only answer that the distribution is random.
In the ensuing classes, we start discussing the role of government in this respect. I start by showing them the relationship between the number of trades and the earnings earned. Does this demonstrate that some people are better at making trades?
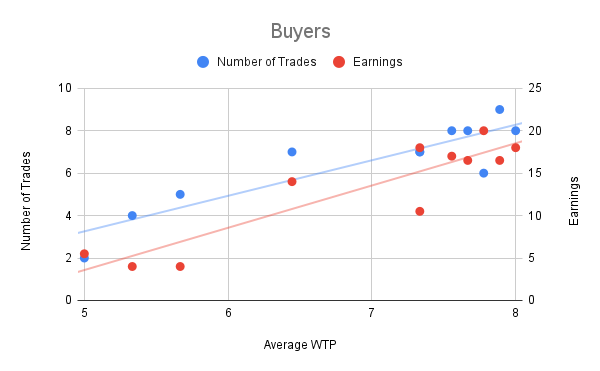 Because students recorded the cards they received, I can show them that there is a common factor influencing both: for buyers, the average willingness to pay over the whole experiment is strongly correlated with both the number of trades and the amount of earnings.
The student who had the highest earnings had only a 2% chance to draw these cards or a better distribution. Does this mean that I should use the taxes collected to compensate unlucky students? How to determine what comes from luck, what from skill and effort? And is it more likely that this redistribution is going to go to those that really need it, or can I be convinced by those with the highest earnings to redistribute in their direction, skewing even more the earnings distribution? These are some interesting questions to discuss during the following classes.
The folder with slides, earnings sheet and spreadsheet is available here.